EXPAND ENERGY (EXE)·Q4 2025 Earnings Summary
Expand Energy Beats EPS on Record Production as Largest US Gas Producer
February 17, 2026 · by Fintool AI Agent
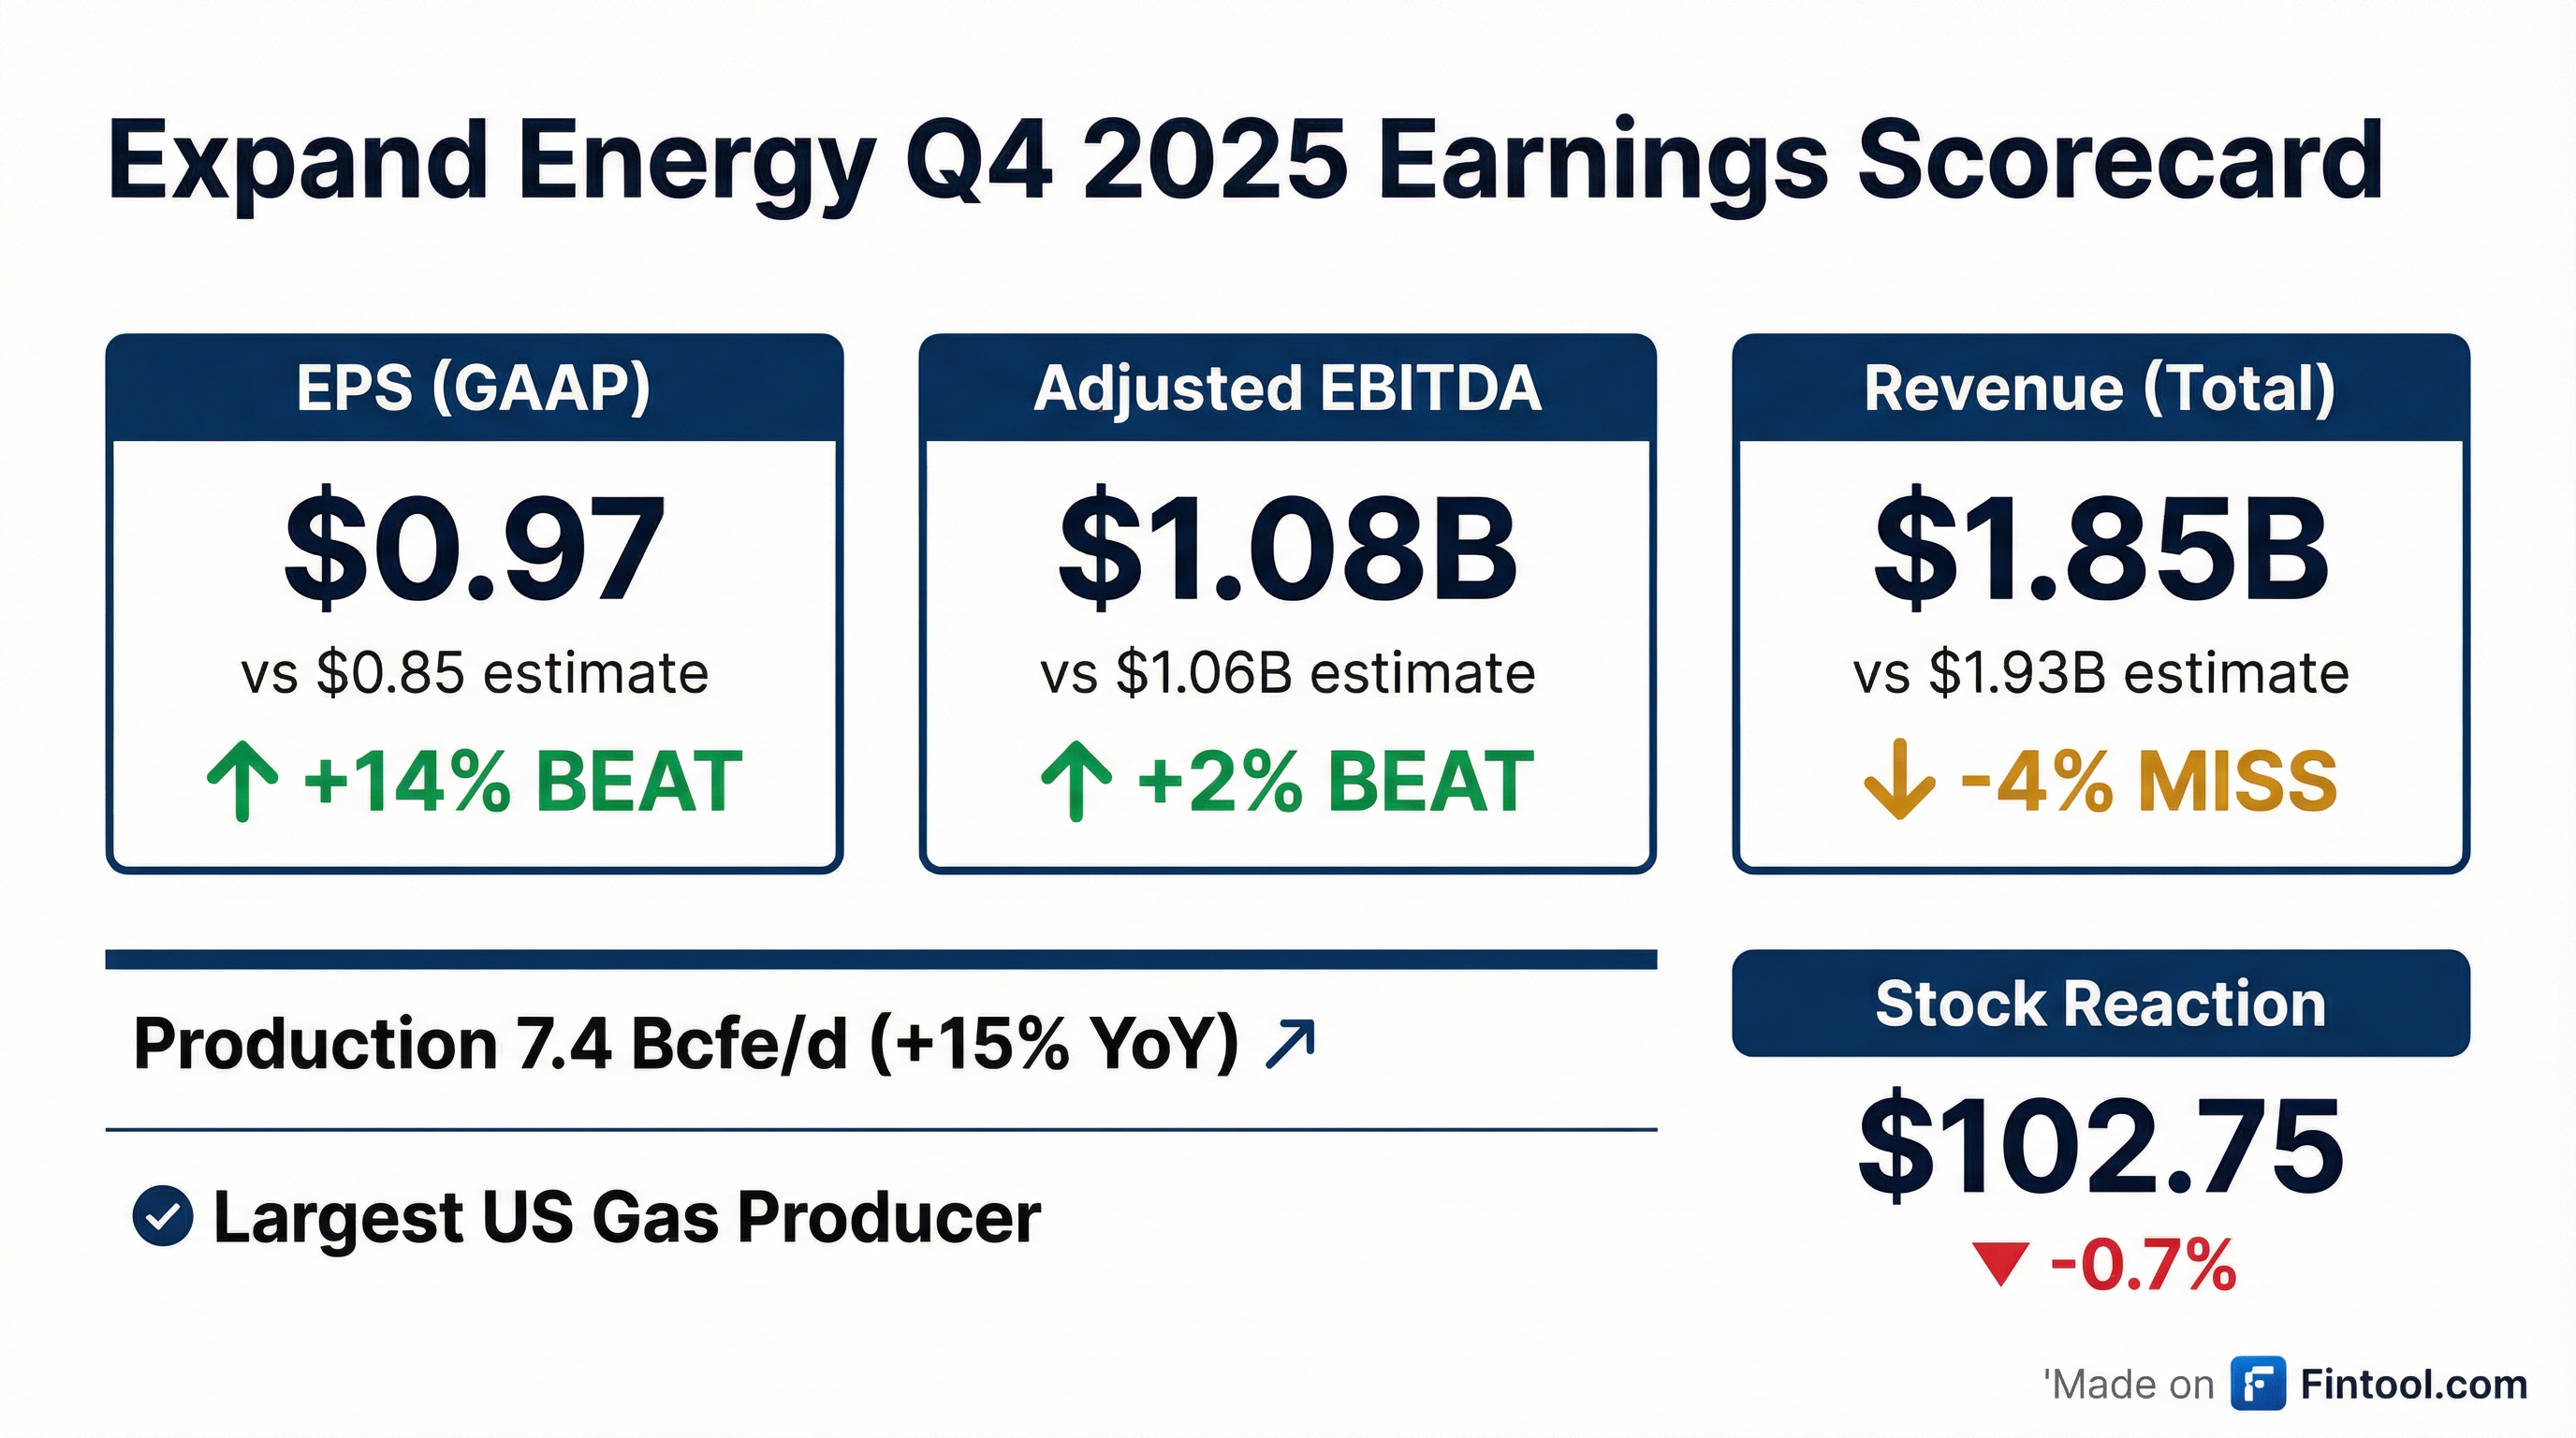
Expand Energy delivered a mixed Q4 2025, beating EPS estimates by 14% while missing on revenue as the company solidified its position as North America's largest natural gas producer. Production surged 15% year-over-year to 7.4 Bcfe/d, generating adjusted EBITDAX of $1.4 billion. The company announced a $2.30 annual dividend and plans to reduce debt by at least $1 billion in 2026 while maintaining production at ~7.5 Bcfe/d.
Did Expand Energy Beat Earnings?
Expand Energy delivered a split decision on Q4 2025 results, beating on profitability but missing on the top line:
Values retrieved from S&P Global
The EPS beat was driven by operational efficiency gains and higher realized prices with hedging benefits. Adjusted net income came in at $481 million, or $2.00 per diluted share, while GAAP net income was $553 million ($2.30/share).
Full-year 2025 highlights:
- Net income: $1.82 billion ($7.57/share diluted)
- Adjusted EBITDAX: $5.08 billion
- Operating cash flow: $4.58 billion
- Free cash flow: $1.84 billion
What Drove the Production Surge?
Expand Energy produced 7.4 Bcfe/d in Q4 2025, up 15% year-over-year, establishing itself as North America's largest natural gas producer. The company operates across three premier basins:
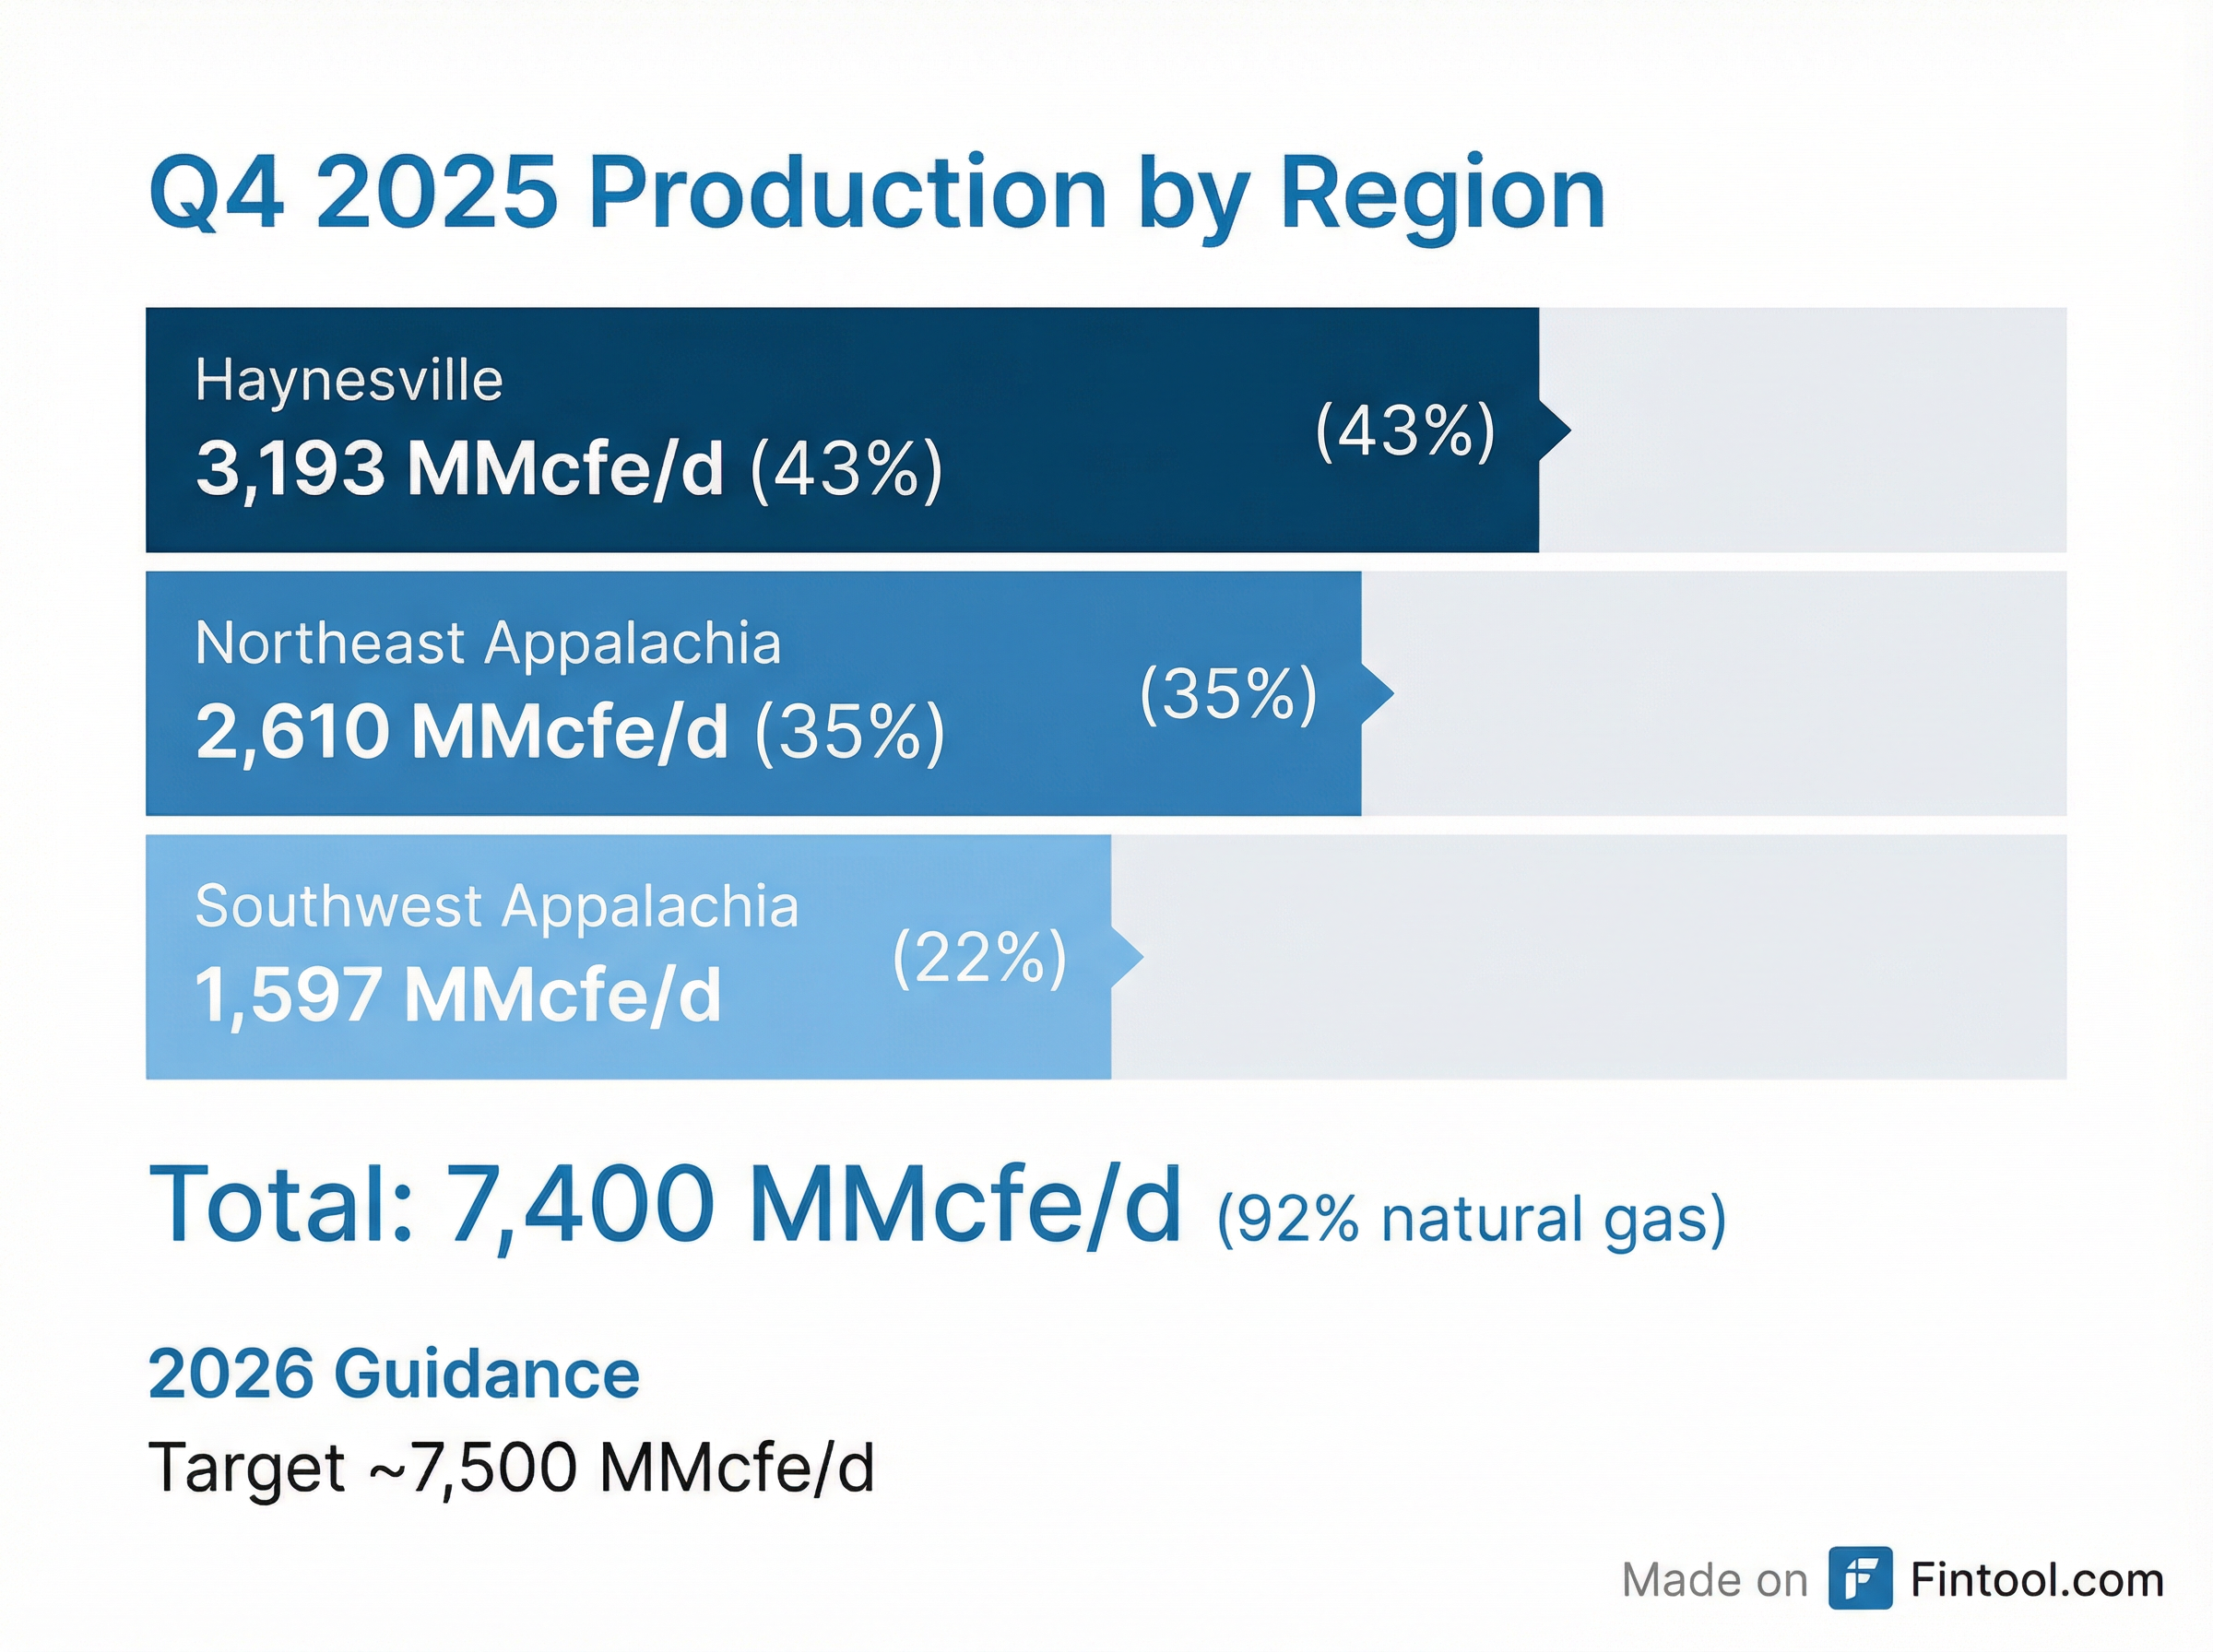
The Haynesville basin was the star performer, with production up 37% YoY. The company improved Haynesville breakevens by approximately 15% since the Southwestern merger close, now achieving sub-$2.75/Mcf breakevens.
What Did Management Guide for 2026?
Expand Energy's 2026 outlook reflects disciplined capital allocation with a focus on balance sheet strengthening:
Key guidance details:
- ~$75 million allocated to Western Haynesville appraisal
- 11-12 rigs planned for 2026 (vs 12 in Q4 2025)
- Production expense guidance: $0.23-$0.28/Mcfe
- Continued focus on opportunistic share repurchases
CEO Mike Wichterich emphasized the company's strategic positioning: "We're creating more value from every molecule, and we're in an advantaged position to meet growing demand in the power, industrial, and LNG markets. In 2026, we expect to deliver higher volumes with less capital, leverage our productive capacity and flexibility to manage volatility, and consistently grow free cash flow."
How Much Capital Is Expand Energy Returning to Shareholders?
Expand Energy demonstrated a balanced approach to capital allocation in 2025, returning $865 million to shareholders while reducing debt:
The Q4 2025 base dividend of $0.575/share will be paid March 26, 2026 to shareholders of record March 5, 2026—marking the 20th consecutive quarter of dividend payments.
Debt profile: The company ended Q4 2025 with $5.0 billion in total debt and $4.4 billion in net debt. Investment-grade ratings (BBB-/Baa3/BBB-) provide favorable financing access. Callable debt provides an efficient pathway to reduction—2029 maturities become callable at par in 2026.
What Changed From Last Quarter?
Several key developments emerged this quarter:
Operational improvements:
- Haynesville breakevens improved ~15% since merger close
- 2025 was the company's fastest drilling year ever (feet per day)
- Production expense down ~20% from original FY25 guidance
- Average well productivity up ~11% since 2022
Strategic initiatives:
- NG3 pipeline in-service (October 2025), increasing Gulf Coast connectivity
- ~350,000 MMBtu/d of additional term sales to Gulf Coast end-users in Q4
- New storage capacity added (5 Bcf total) for enhanced market optionality
- Western Haynesville acreage additions provide inventory upside
Synergy capture: The company exceeded original merger synergy targets, with operational performance driving down reinvestment rates.
How Deep Is the Inventory?
Expand Energy touts 20+ years of drilling inventory across its three basins, providing long-term visibility:
The company added ~1.5 million feet of completable lateral via organic leasing and bolt-ons in 2025. Southwest Appalachia development now features laterals exceeding 20,000 feet—the longest surpassing 27,000 feet, a record for both the basin and US land.
What's the Hedge Position?
Expand Energy maintains a disciplined hedge program with 66% of 2026 volumes hedged:
The hedge book provides downside protection while preserving upside participation to higher prices through collar structures.
How Did the Stock React?
EXE shares closed at $102.75 on February 17, 2026, down 0.75% from the prior close of $104.05. Aftermarket trading showed the stock at $102.45. The muted reaction suggests the results were largely in-line with investor expectations despite the EPS beat.
Valuation context:
- Current price: $102.75
- 52-week range: $91.02 - $126.62
- Market cap: ~$24.5 billion
- 50-day average: $109.03
- 200-day average: $107.65
Values retrieved from S&P Global
The stock is trading approximately 6% below its 50-day moving average, reflecting broader natural gas price volatility concerns.
What Should Investors Watch?
Near-term catalysts:
- Q1 2026 production ramp to guided ~7.4-7.5 Bcfe/d
- Western Haynesville appraisal results
- Natural gas price trajectory and LNG export demand
- Debt reduction progress toward $1B+ target
Risk factors flagged by management:
- Natural gas price volatility
- Competition in the E&P industry
- Execution risk on operational improvements
- Geopolitical factors affecting global energy markets